Introduction
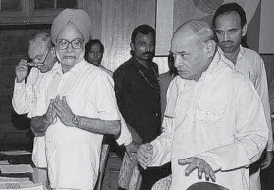
The LPG is considered a game changer for the Indian economy, adopted on July 24 1991, under the government of P.V. Narasimha Rao. We conducted a study on the Indian Economy pre- & post-liberalisation to understand whether the introduction of the LPG policy boosted the Indian Economy. To compare the Indian Economy growth pre & post Liberalisation, we conducted our study in two phases/part, 1st discussing about the key changes that were introduced in the Indian Economy due to its adoption & 2nd comparing the Indian Economy pre & post liberalisation on different parameters.
1991: The Year India Changed Everything
Picture India before 1991, the economy was like a tightly locked door that shut down for foreign companies. The government decide who can start a business, what can be produced, and even how much. This system, often called the License Raj, made entrepreneurs run through endless paperwork just to keep their companies alive. Imports were restricted to “protect” local industries, but the result was slow growth, limited choices, and very little innovation.
Then came the crisis. By the early ’90s, India’s foreign reserves had almost dried up, and we barely had enough money to cover a few weeks of imports. It was a national emergency that forced the government to act. Enter the LPG reforms: Liberalisation loosened regulations and cut the red tape that strangled businesses. Privatisation reduced the monopoly of state-owned enterprises, letting private companies step in and compete. And globalisation threw open the windows, allowing India to connect with the global economy, attract foreign investment, and give consumers more choices than ever before.
The Good, the Bad, and the New India
The results were transformative. Industries expanded, foreign companies invested heavily, and India’s service sector, especially IT and telecommunication,s took off like a rocket. Suddenly, firms like Infosys and Wipro were making India known worldwide. For the first time, the economy began shifting from being primarily agricultural to one driven by services and industry. But it wasn’t perfect. The benefits weren’t evenly spread; some regions grew rapidly while others lagged, and income inequality widened. India also became more exposed to global ups and downs, meaning international crises could ripple through our markets. Still, the LPG reforms marked a turning point, unlocking India’s potential and reshaping its economic destiny
Comparison of Pre & Post Economic Data
1) Comparison of GDP Growth Pre & Post Liberalisation (1960 to 2020)

| Year | Gross Domestic Product |
| 1960 | $37.03B |
| 1961 | $39.23B |
| 1962 | $42.16B |
| 1963 | $48.42B |
| 1964 | $56.48B |
| 1965 | $59.56B |
| 1966 | $45.58B |
| 1967 | $50.13B |
| 1968 | $53.09B |
| 1969 | $58.45B |
| 1970 | $62.42B |
| 1971 | $67.35B |
| 1972 | $71.46B |
| 1973 | $85.52B |
| 1974 | $99.53B |
| 1975 | $98.47B |
| 1976 | $102.72B |
| 1977 | $121.49B |
| 1978 | $137.3B |
| 1979 | $153B |
| 1980 | $186.33B |
| 1981 | $193.49B |
| 1982 | $200.72B |
| 1983 | $218.26B |
| 1984 | $212.16B |
| 1985 | $232.51B |
| 1986 | $248.99B |
| 1987 | $279.03B |
| 1988 | $296.59B |
| 1989 | $296.04B |
| 1990 | $320.98B |
| 1991 | $270.11B |
| 1992 | $288.21B |
| 1993 | $279.3B |
| 1994 | $327.27B |
| 1995 | $360.28B |
| 1996 | $392.9B |
| 1997 | $415.87B |
| 1998 | $421.35B |
| 1999 | $458.82B |
| 2000 | $468.4B |
| 2001 | $485.44B |
| 2002 | $514.94B |
| 2003 | $607.7B |
| 2004 | $709.15B |
| 2005 | $820.38B |
| 2006 | $940.26B |
| 2007 | $1.22T |
| 2008 | $1.2T |
| 2009 | $1.34T |
| 2010 | $1.68T |
| 2011 | $1.82T |
| 2012 | $1.83T |
| 2013 | $1.86T |
| 2014 | $2.04T |
| 2015 | $2.1T |
| 2016 | $2.29T |
| 2017 | $2.65T |
| 2018 | $2.7T |
| 2019 | $2.84T |
| 2020 | $2.67T |
Growth Analysis
| Decade | Start Year | End Year | Start Value ($) | End Value ($) | % Change |
| 1960s | 1960 | 1969 | $37.03B | $62.42B | 37.9% |
| 1970s | 1970 | 1979 | $62.42B | $186.33B | 137.3% |
| 1980s | 1980 | 1989 | $186.33B | $320.98B | 40.2% |
| 1990s | 1990 | 1999 | $320.98B | $468.48 | 18.1% |
| 2000s | 2000 | 2009 | $468.4B | $1.68T | 206.2% |
| 2010s | 2010 | 2019 | $1.68T | $2.84T | 52.9% |
As we can see in the above chart, before 1990, the GDP growth chart shows a stagnant growth in the Indian GDP, but with the adoption of LPG policies, we can see the effects of this not in the following years (1991-1995). A major spike in the growth of the Indian GDP occurred after the year 2000.
After conducting the research, we found that the main reason for the Indian GDP growth is FDI (Foreign Direct Investment) & Foreign countries’ manufacturing plants in India.
2) Comparison of Per Capita Income Pre & Post Liberalisation era
| Years | Per-Capita Income |
| 1960 | $84.9 |
| 1961 | $87.9 |
| 1962 | $92.2 |
| 1963 | $103.4 |
| 1964 | $117.9 |
| 1965 | $121.5 |
| 1966 | $91 |
| 1967 | $98 |
| 1968 | $101.6 |
| 1969 | $109.5 |
| 1970 | $114.4 |
| 1971 | $120.7 |
| 1972 | $125.3 |
| 1973 | $146.6 |
| 1974 | $166.7 |
| 1975 | $161.1 |
| 1976 | $164.1 |
| 1977 | $189.6 |
| 1978 | $209.4 |
| 1979 | $228 |
| 1980 | $271.1 |
| 1981 | $275 |
| 1982 | $278.7 |
| 1983 | $296 |
| 1984 | $281 |
| 1985 | $300.9 |
| 1986 | $314.9 |
| 1987 | $344.9 |
| 1988 | $358.5 |
| 1989 | $349.9 |
| 1990 | $337.1 |
| 1991 | $305.6 |
| 1992 | $319.2 |
| 1993 | $302.9 |
| 1994 | $347.7 |
| 1995 | $375.2 |
| 1996 | $401 |
| 1997 | $416.2 |
| 1998 | $413.6 |
| 1999 | $441.9 |
| 2000 | $442.8 |
| 2001 | $450.4 |
| 2002 | $469.1 |
| 2003 | $544.1 |
| 2004 | $624.3 |
| 2005 | $710.5 |
| 2006 | $801.7 |
| 2007 | $1021.9 |
| 2008 | $992.5 |
| 2009 | $1094.9 |
| 2010 | $1347.5 |
| 2011 | $1445.5 |
| 2012 | $1429.3 |
| 2013 | $1432.8 |
| 2014 | $1553.9 |
| 2015 | $1584 |
| 2016 | $1707.5 |
| 2017 | $1950.1 |
| 2018 | $1966.3 |
| 2019 | $2041.4 |
| 2020 | $1907 |
Growth Analysis
| Decade | Start Year | End Year | Start Value ($) | End Value ($) | % Change |
| 1960s | 1960 | 1968 | 84.9 | 109.5 | 28.98% |
| 1970s | 1970 | 1979 | 114.4 | 228 | 99.47% |
| 1980s | 1980 | 1989 | 271.1 | 349.9 | 29.09% |
| 1990s | 1990 | 1999 | 337.1 | 441.9 | 31.08% |
| 2000s | 2000 | 2009 | 442.8 | 1094.9 | 147.26% |
| 2010s | 2010 | 2019 | 1347.5 | 2041.4 | 51.48% |
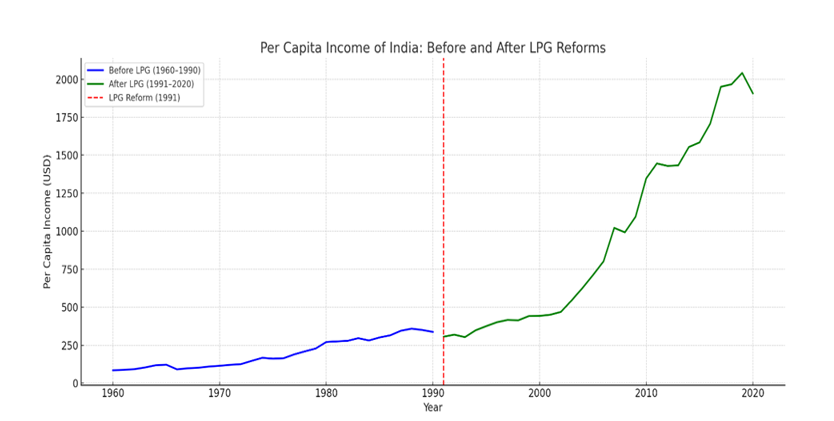
Per-capita income refers to the total income earned by a nation divided by/total population of that nation. Per-capita income is also a very important criterion to examine a country’s economic growth.
From the above chart, we can see that just like in GDP, in Per Capita income, before the adaptation of LPG, the growth rate of Per Capita income is very stagnant, but after the adaptation of LPG, the growth rate of Per Capita income takes a huge spike after 2000
3) Comparison of India’s forex reserve in the pre- & post-Liberalisation era
| Year | Forex Reserve |
| 1960 | $674.5 million |
| 1961 | $666.4 million |
| 1962 | $512.8 million |
| 1963 | $607.9 million |
| 1964 | $499.1 million |
| 1965 | $600.9 million |
| 1966 | $609.7 million |
| 1967 | $663.8 million |
| 1968 | $730.4 million |
| 1969 | $927.8 million |
| 1970 | $1.02 billion |
| 1971 | $1.25 billion |
| 1972 | $1.37 billion |
| 1973 | $1.63 billion |
| 1974 | $2.32 billion |
| 1975 | $2.06 billion |
| 1976 | $3.73 billion |
| 1977 | $6.09 billion |
| 1978 | $8.32 billion |
| 1979 | $11.82 billion |
| 1980 | $12.01 billion |
| 1981 | $8.11 billion |
| 1982 | $8.24 billion |
| 1983 | $8.22 billion |
| 1984 | $8.54 billion |
| 1985 | $9.49 billion |
| 1986 | $10.48 billion |
| 1987 | $11.51 billion |
| 1988 | $9.19 billion |
| 1989 | $8.05 billion |
| 1990 | $5.64 billion |
| 1991 | $7.62 billion |
| 1992 | $5.8 billion. |
| 1993 | $14.67 billion |
| 1994 | $24.22 billion |
| 1995 | $22.86 billion |
| 1996 | $24.89 billion |
| 1997 | $28.39 billion |
| 1998 | $30.65 billion |
| 1999 | $36.01 billion |
| 2000 | $41.06 billion |
| 2001 | $49.05 billion |
| 2002 | $71.61 billion |
| 2003 | $103.74 billion |
| 2004 | $131.63 billion |
| 2005 | $137.83 billion |
| 2006 | $178.05 billion |
| 2007 | $276.58 billion |
| 2008 | $257.42 billion |
| 2009 | $284.68 billion |
| 2010 | $300.48 billion |
| 2011 | $298.74 billion |
| 2012 | $300.43 billion |
| 2013 | $298.09 billion |
| 2014 | $325.08 billion |
| 2015 | $353.32 billion |
| 2016 | $361.69 billion |
| 2017 | $412.61 billion |
| 2018 | $399.17 billion |
| 2019 | $463.47 billion |
| 2020 | $590.23 billion |
Growth Analysis
| Decade | Start Year | End Year | Start Value ($) | End Value ($) | % Change |
| 1960s | 1960 | 1969 | $37.03B | $58.45B | 57.84% |
| 1970s | 1970 | 1979 | $62.42B | $153B | 145.11% |
| 1980s | 1980 | 1989 | $186.33B | $296.04B | 58.88% |
| 1990s | 1990 | 1999 | $320.98B | $458.82B | 42.94% |
| 2000s | 2000 | 2009 | $468.4B | $1.34T | 186.08% |
| 2010s | 2010 | 2019 | $1.68T | $2.84T | 69.05% |
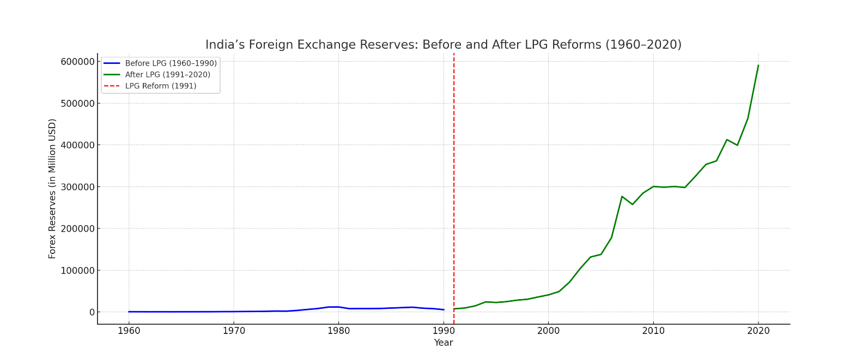
The forex reserve plays a very Important role in determining a nation’s economic growth because it is crucial for any nation to conduct global trade.
As we see, before the pre-LPG era, the foreign exchange reserve of the country was stagnant & somehow depleting. The reason was India’s closed economy for foreign & limited trade with foreign countries, but after the adoption of the LPG policy, we can see a significant growth in the Indian forex reserve in the era of the 2000s & again in 2018.
Conclusion
By studying the above criteria & charts, we can conclude that although the growth of the Indian Economy was not as booming in the initial years after the adoption of Liberalisation, a decade later, it shows its true effects on the Indian economy. We clearly saw the effect of the LPG in the period between 2000 and 2010.
In those 10 years, the country saw a great boom in the economy.
Forex Reserve Grew by:- 186%
Per Capita Income Grew By:- 147%
Gross Domestic Product Grew By:- 206%
So, by looking at these numbers, we clearly see that the LPG policy had a positive effect on the India Economy.